
Map Overview
Map Intelligence Layer
The map is the gateway into the corridor graph. Use it to move from geography into asset-level pages, financing pages, mine profiles, infrastructure risk, and source packs.
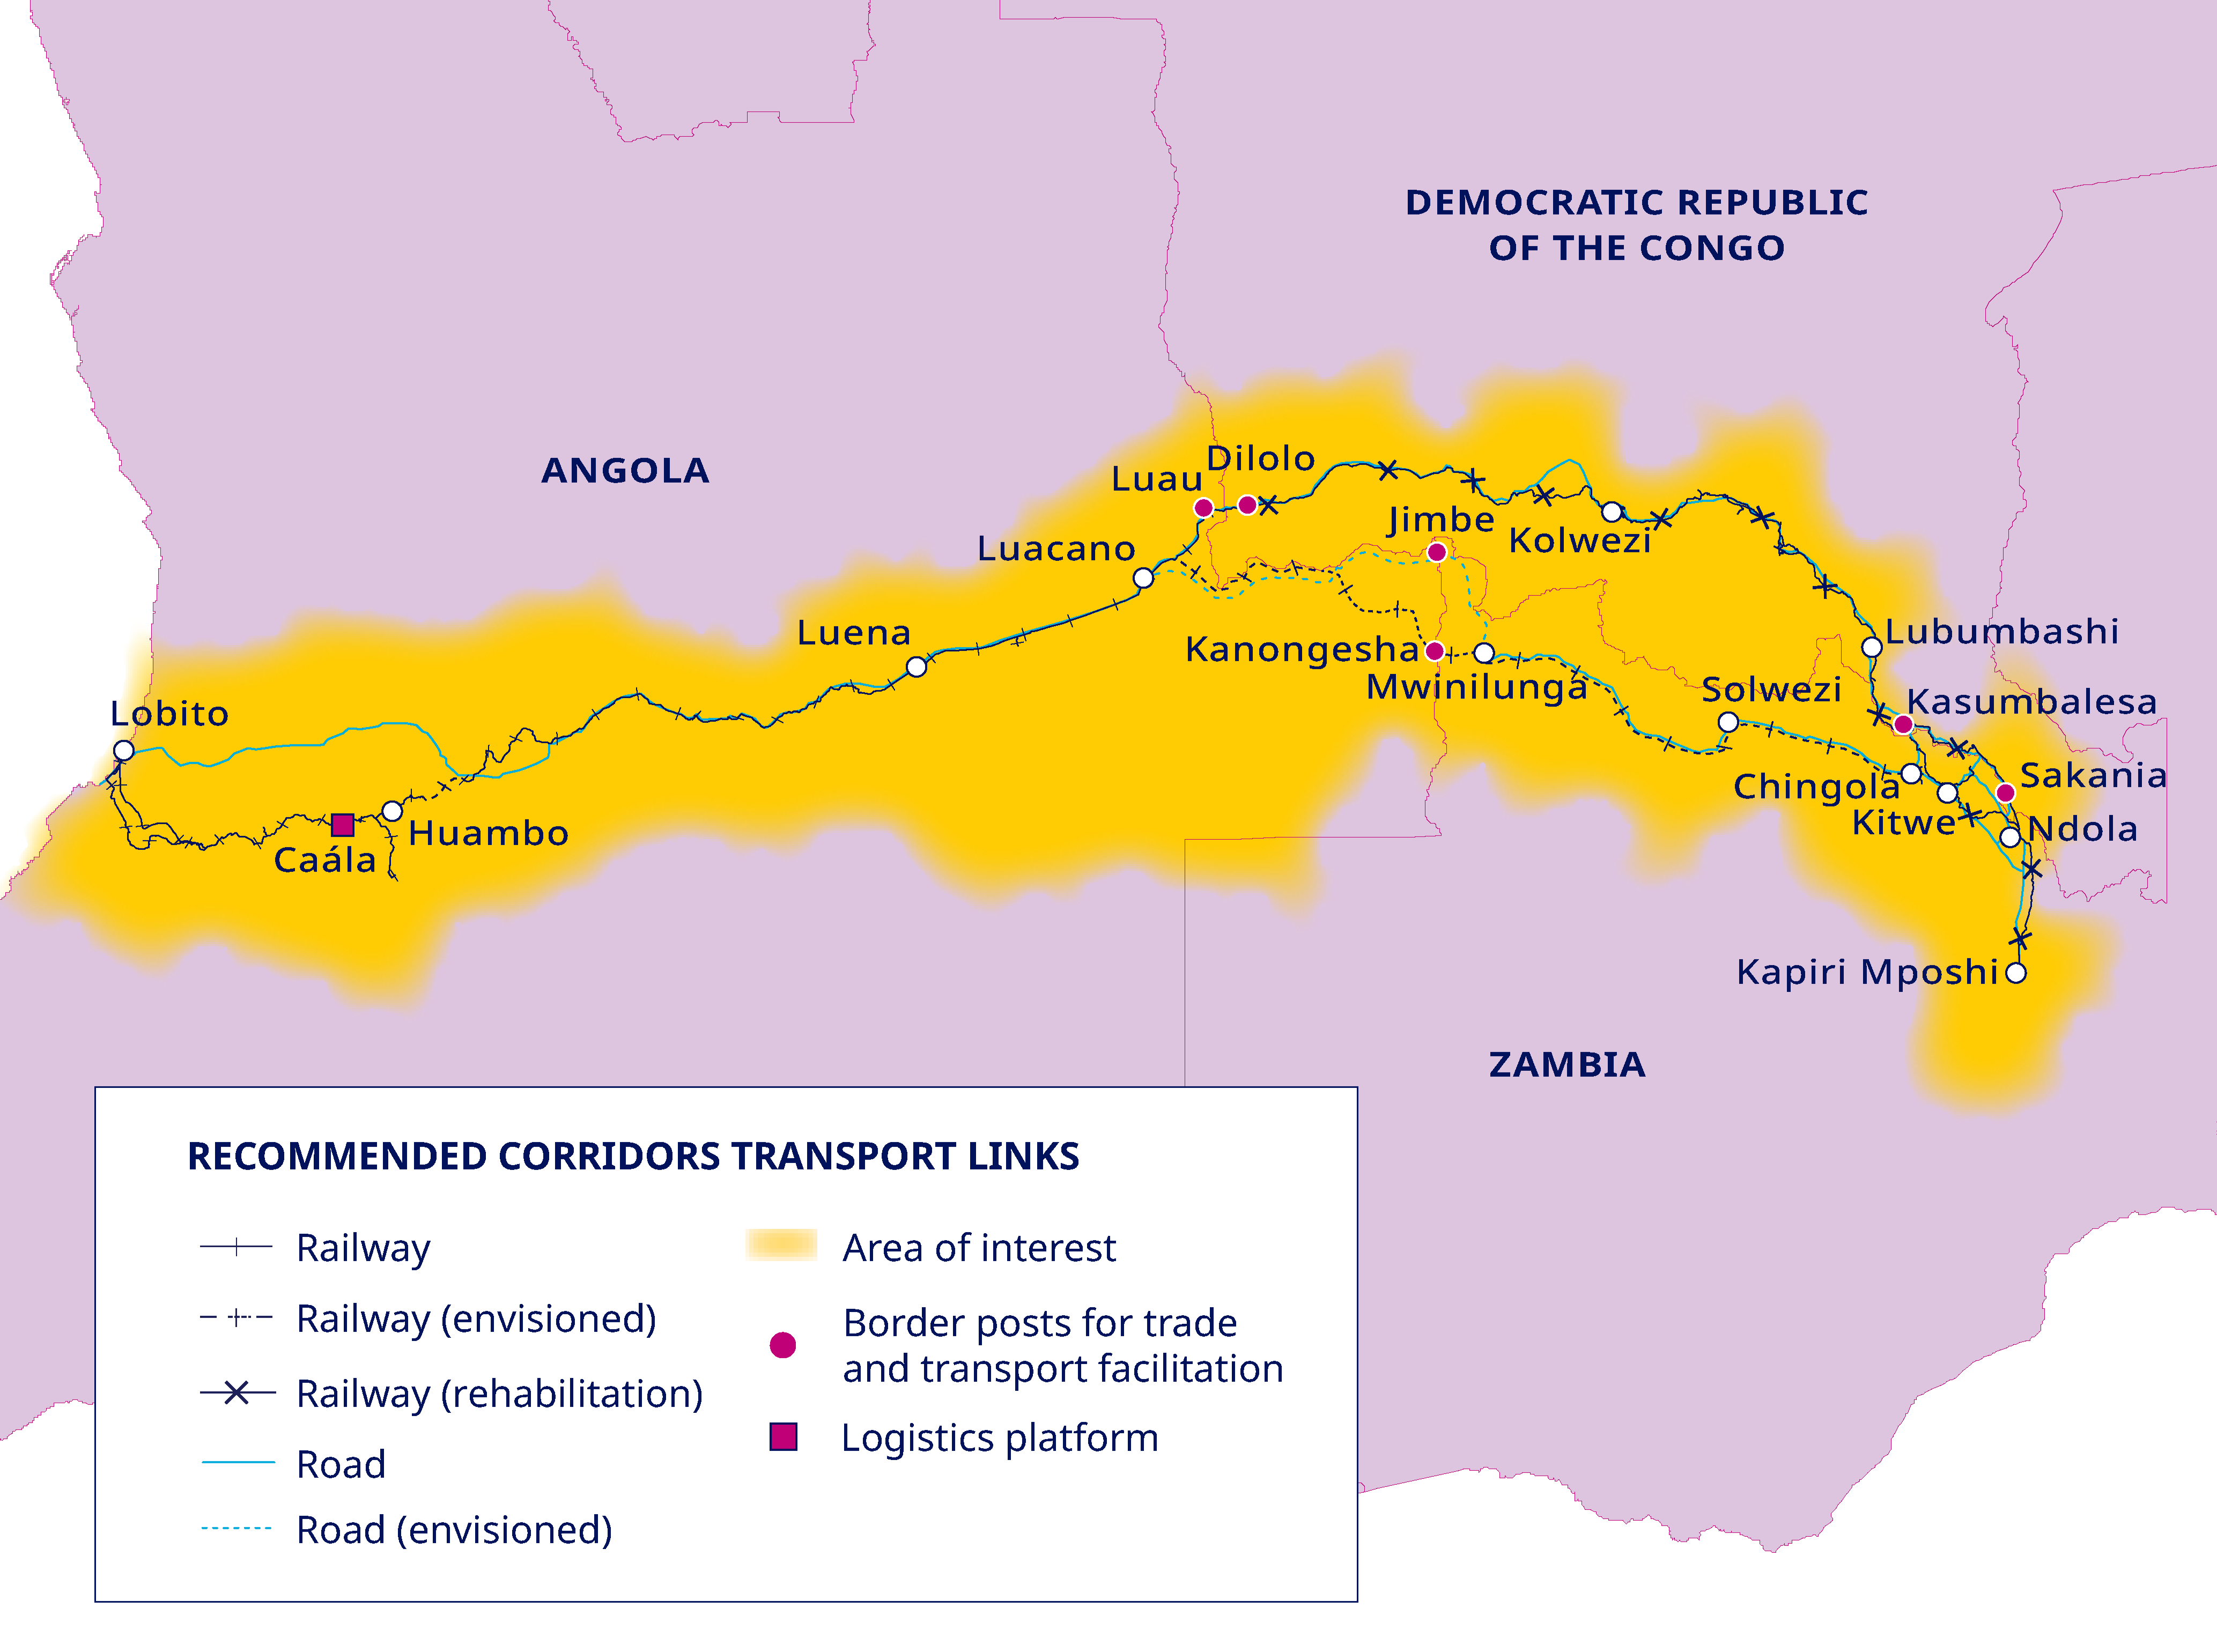
The operating Angolan rail spine runs approximately 1,300 km from the Port of Lobito on Angola's Atlantic coast to Luau on the DRC border. Lobito Atlantic Railway also describes a 450 km DRC connection from Luau to Kolwezi, making the Kolwezi-to-Lobito rail route about 1,739 km. The planned Zambia extension is a separate greenfield link intended to connect Zambia's Copperbelt directly to the Angolan system.
How to Read This Page
Read this map as a corridor sequence rather than a static railway diagram: port terminal, Angolan rail spine, Dilolo border interface, DRC rail constraint, Kolwezi mining catchment, and planned Zambia connection. The route matters because each node controls a different risk category: maritime handling at Lobito, rail reliability across Angola, customs and interchange at Dilolo, rehabilitation and social risk in the DRC, and anchor-customer demand from Zambia.
Key Features
The route map highlights railway stations, border crossing points (Dilolo/DRC-Angola, Kasumbalesa/DRC-Zambia), gauge interchange facilities, and the Luacano-Jimbe branch line. Key infrastructure nodes include the Lobito mineral terminal, the Benguela marshalling yard, and the Kolwezi rail hub serving the major DRC mining operations. The construction timeline shows phased completion dates for each segment.
Corridor Relevance
The map is the base layer for interpreting the authority graph: it connects Port of Lobito, Benguela Railway, Dilolo-Kolwezi Railway, and Zambia-Lobito Greenfield Railway into one logistics chain. Use it alongside copper production, cobalt production, and investment flow pages to test whether mine output, financing, and route capacity are aligned.
Data Sources
Route data is compiled from Lobito Atlantic Railway operational documentation, European Commission corridor materials, MIGA project disclosures, AFC and USTDA Zambia-Lobito releases, government infrastructure plans, and satellite imagery analysis. Distances distinguish between the 1,289 km operating Angolan rail spine (commonly rounded to 1,300 km), LAR's 450 km DRC access section to Kolwezi, and the planned Zambia-Lobito extension, cited as 830 km by AFC and 485 miles by USTDA.
Data Caveats
Map layers should be treated as operational intelligence rather than legal survey data. Station counts, route condition, and border handling arrangements can change as rehabilitation progresses. Any investment, displacement, or public-policy conclusion should be cross-checked against the linked infrastructure profiles and source packs before external reuse.
Where this fits
This file is part of the corridor data layer used to cross-check routes, production, investment flows, maps, and tracker pages.
Editorial Note
This map page is designed as a concise research gateway, not as a closed encyclopedia article. Its editorial job is to define the subject, explain why it matters to the Lobito Corridor, and route readers toward deeper profiles, datasets, and primary sources. Updates are made when new public data, official disclosures, regulatory changes, or public-source review materially alters the corridor assessment.
For institutional users, the page should be read as an index layer: it helps locate the relevant company, mine, community, regulation, commodity, or infrastructure file before moving into article-length analysis. Claims that affect investment, human-rights, ESG, or public-policy interpretation should be checked against the linked source pack and the underlying corridor database before being reused externally.
How To Use This Map
In corridor research, short reference pages are useful only when they make the next analytical move clear. This map should therefore be used as a signpost into the wider evidence base: follow the internal links for project-level detail, use the source pack where primary verification is required, and treat unsourced commercial or policy claims as provisional until checked against official data or direct disclosure. The page is intentionally kept operational: it tells an analyst what the item means, why it matters, which corridor actors are affected, and where to go next for decision-grade context.
Evidence Base
This page is maintained against public institutional sources, official corridor materials, development-finance records, mineral-market datasets, and documented source review.
Primary Institutional Sources
- European Commission: Lobito Corridor
- U.S. DFC: Lobito Atlantic Railway financing
- EITI: Lobito Corridor transition-mineral partnerships
- USGS National Minerals Information Center
- World Bank data: Angola · DRC · Zambia
Review Standard
Figures, timelines, ownership claims, policy references, financing terms, and operational status should be checked against primary records, official disclosures, operator materials, public filings, or recognized datasets before reuse.